To view data from a connected Solinst Levelogger datalogger, or previously connected datalogger, select the datalogger image from the Dataloggers Screen. A list of all saved data logs for that datalogger will be shown. Tap the plot icon ![]() beside the data log that you want to view. (double tap on a phone).
beside the data log that you want to view. (double tap on a phone).
On an iOS device, tapping the area to the left of the plot icon (showing serial number and number of logs), will bring up the settings the datalogger used during that logging session.
On an Adroid phone, tapping the settings icon ![]() , will bring up the settings the datalogger used during that logging session.
, will bring up the settings the datalogger used during that logging session.
Note:
The red number on the datalogger image indicates the number of saved data logs. This includes downloaded logs and real-time logs.
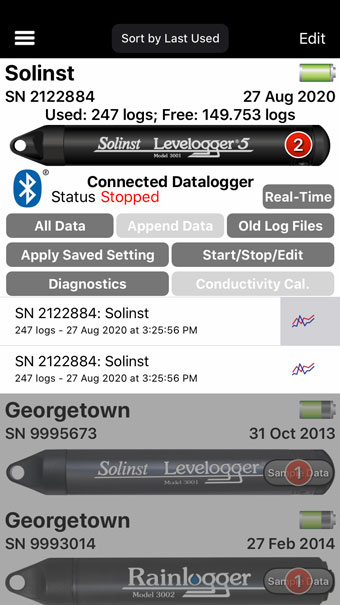
Figure 9-1 Viewing Saved Logs - iOS
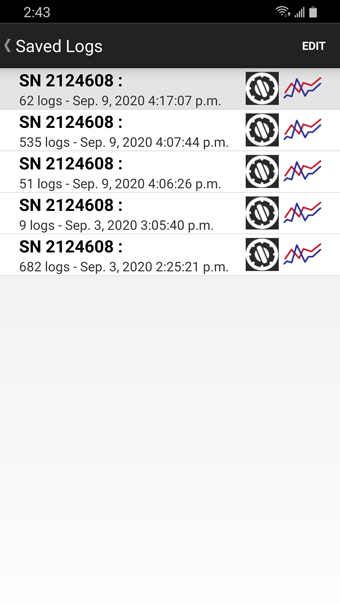
Figure 9-2 Viewing Saved Logs - Android
On an iOS device, you can only delete Saved Logs when that datalogger is disconnected from the App. Delete logs from the list by swiping left.
On an Android device, you can delete Saved Logs from the list by tapping Edit at the top right of the list, then selecting the logs you want to delete.
The data log will be shown in a graphical format (Plot). If allowed in User Defaults (Plot). If allowed in User Defaults (Section 4.3), tapping the screen in an iOS device, will show you the value of that data point, including the data and time. Tap and hold to show the value on an Android device. You can use gestures to scroll through the data, and zoom in and out.
Note:
On an iPad, tapping ![]() will expand the Plot screen to full screen.
will expand the Plot screen to full screen.
Note:
Viewing the data plot in a horizontal orientation is also an option.
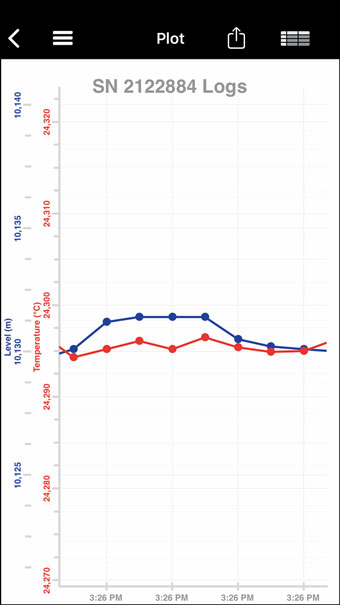
Figure 9-3 Viewing Saved Data Log Plot - iOS
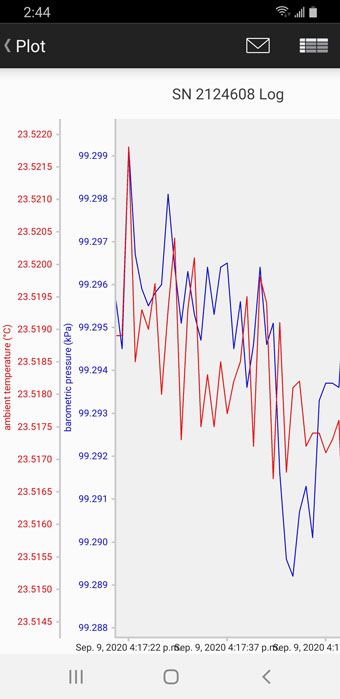
Figure 9-4 Viewing Saved Data Log Plot - Android
Note:
When viewing Solinst Rainlogger data, you can select the time "Interval" at which you would like the data shown, from 1 to 99 seconds, minutes, hours, days, or weeks (this acts like a zoom function).
When viewing data you have the option to e-mail the data log. See Section 10.1 for e-mailing data.
You can select ![]() to view the saved data log in a list format.
to view the saved data log in a list format.
Note:
User Defaults (see Section 4.3) allows adjustment of how the plot symbols are shown and whether the data pop-up appears when a plot point is touched.
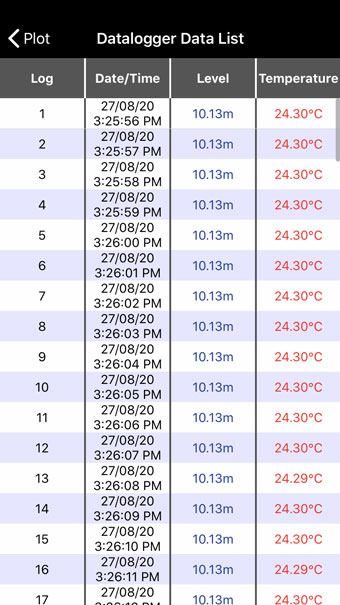
Figure 9-5 Viewing Saved Data Log List - iOS
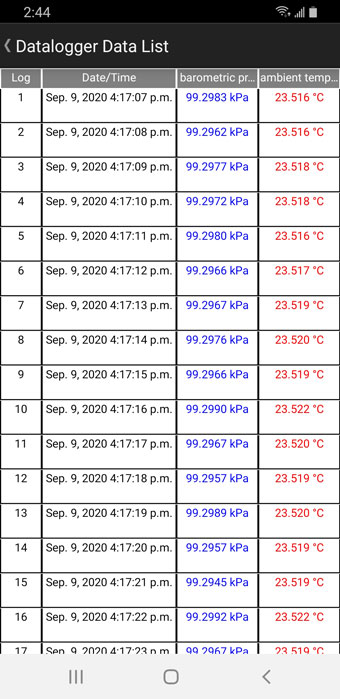
Figure 9-6 Viewing Saved Data Log List - Android
Note:
Touching a data point in the list will highlight the same point in the plot view.


