Click the Real Time View tab from the Main Window (Figure 7-1). The purpose of this tab is to provide on-screen measurement as data is being recorded by the connected datalogger. The data is displayed in tabular and graphical format. All the channel information and datalogger settings are displayed on the left of the window.
First, select a non-logged view rate 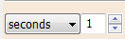 . This rate can be set independently of the logging period of the datalogger and does not interfere with any logging taking place in the LevelVent or AquaVent itself.
Checking, Enable Manual Data Adjustment, allows you to enter a datum/ field zero (e.g. depth to water level) to which the change in Real Time View level measurements are then adjusted against. This is only available when you are taking readings in m, cm, or ft.
Note:
Datalogger settings can not be changed in the Real Time tab. Changes must be made in the Datalogger Settings tab. The changes are applied when the Real Time readings are started. ![]()
Real Time View readings can be displayed as a graph or in tabular format. The same graphing options as the Data Control tab are available for Real Time View readings. Real Time View readings are being recorded within the Levelogger Software and prior to closing the window, they can be saved by exporting the data into a *.csv file, by choosing the file export option ![]() .
.
To start the current readings, click ![]() . The readings will be displayed immediately.
. The readings will be displayed immediately.
To take a reading at any specific time, click the ![]() button and that reading will be added to the displayed data. To turn the Real Time View monitoring off, decide if you want to save the data as described above, and simply click
button and that reading will be added to the displayed data. To turn the Real Time View monitoring off, decide if you want to save the data as described above, and simply click ![]() .
.

Figure 7-1 Real Time View Window