Note:
Right click, and drag the mouse to scan the data graph.
To perform the Zoom In function on the graph, click ![]() .
.
To perform a Zoom Out function on the graph click ![]() . Click
. Click ![]() to undo all the zoom functions.
to undo all the zoom functions.
The Zoom functions can also be used for data selections in the graph.
Click ![]() to open the Graph Option Dialog. The Graph Dialog is shown in Figure 5-5.
to open the Graph Option Dialog. The Graph Dialog is shown in Figure 5-5.
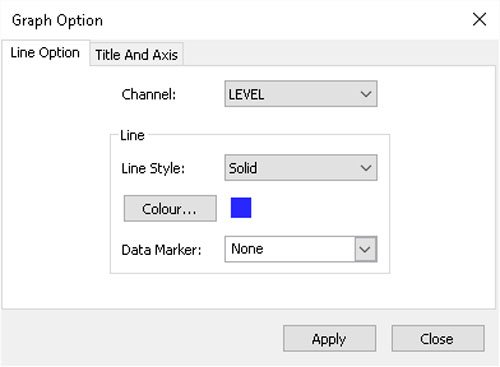
Figure 5-5 Line Option Window
The Line Option is used to adjust the style and colour of the line in the graph for each channel. The user can also select the shape of the data marker or remove the data marker.
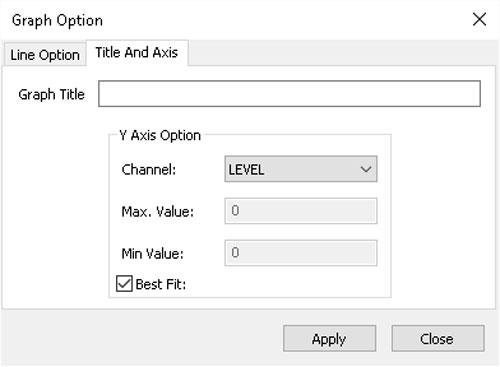
Figure 5-6 Title and Axis Option window
The Title and Axis Option is used to enter the title of the graph and change the Y axis label or user selected scale. Check the Best Fit box to enable the software to determine the best fit scale. If the Best Fit box is not checked, the user has to enter a maximum and minimum value of the selected channel. The X axis is logging time.
There is the option to show Combined Plot graphs or Separated Plot graphs of the data. Choosing a Combined Plot will show the data from each of the channels in one graph. The Separated Plot option will show a separate graph for each data channel.
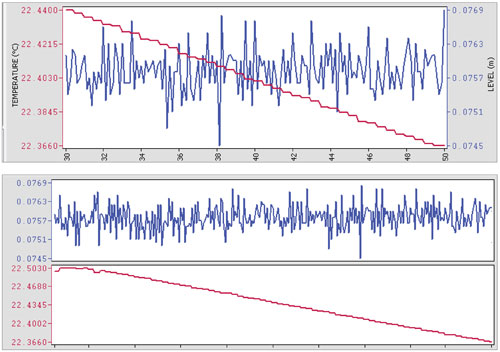
Figure 5-7 Combined and Separated Plot Graphs
There is also the option to view more than one graph at a time. Click and drag a File Name Tab and drop it when you see a shaded area on the window to open a separate graph of that data file. You can view any number of graphs at one time by re-sizing your window as required.
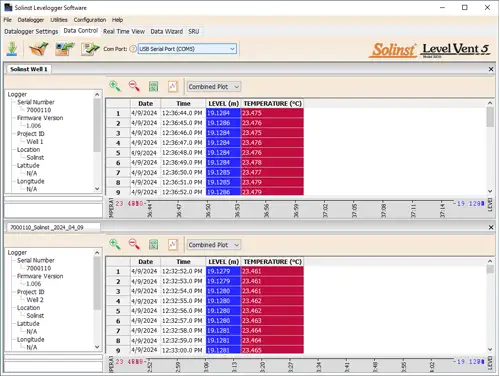
Figure 5-8 Viewing Two Graphs


