How Using a Levelogger and 101D Together Provides Essential Data

The Solinst 101D Water Level DrawDown Meter is Ideal for Monitoring Falling Head Levels in Groundwater Applications
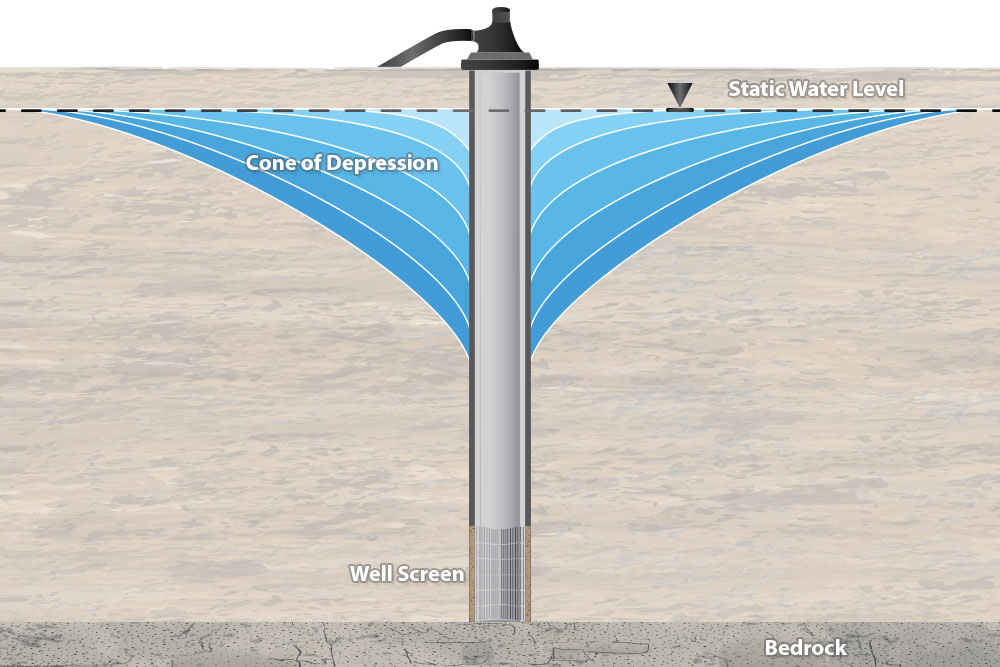
What is Drawdown?
Drawdown is a change in groundwater level due to an applied stress, caused by events such as:
- Pumping from a well
- Pumping from a neighbouring well
- Intensive water taking from local area
- Seasonal declines as recharge rates lower
How is Drawdown Measured?
Levelogger Water Level Dataloggers
Drawdown can be measured using a pressure transducer with built-in datalogger that records water level fluctuations over time – a Solinst Model 3001 Levelogger, for example. Leveloggers are easily Installed below the lowest anticipated drawdown level to record water levels as often as 1/8th of a second. Leveloggers are ideal to use when more frequent drawdown readings, or continuous long-term water level monitoring is required.
Solinst Levelogger 5 Water Level Datalogger for Continuous Drawdown Measurements
101D Water Level DrawDown Meter
The Solinst Model 101D Water Level DrawDown Meter measures depth to water and detects falling head levels (drawdown). The 101D provides a manual measurement method when only periodic water level and drawdown measurements are required. One simple toggle makes it easy to switch between the two functions. In Drawdown mode, the 101D can ensure drawdown levels remain constant, as the buzzer and light sound when the probe is out of water.

Solinst Model 101D Water Level DrawDown Meter for Manual Depth to Water and Drawdown Measurements
Note: for ease of use when lowering and raising from greater depths, the Solinst 101 Power Winder can be added to a 101D reel.
When Used Together…
Using these two instruments together ensures accurate readings and saves you time when dealing with post data processing.
As a QC check, you can use 101D Water Level DrawDown Meter depth to water measurements to verify the Levelogger is reading correctly. Manual measurements should be taken when the Levelogger is deployed, periodically during the recording period, and at the end of the monitoring period.
After you have downloaded the data from the Levelogger, you can use the depth to water measurements to convert Levelogger pressure readings to depth to water readings or elevation measurements to meet your specific application or model requirements. These calculations done automatically in the Levelogger Software Data Wizard, instead of another spreadsheet program, saves you time.
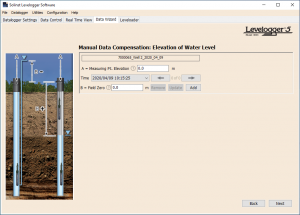
Levelogger Data is Adjusted by Inputing 101D Water Level DrawDown Meter Measurements in the Levelogger Software Data Wizard
Application Notes: Both 101D Water Level DrawDown Meters and 3001 Leveloggers can also be used to aid low flow sampling (monitor drawdown and help regulate pumping rates) – providing more information for a complete aquifer characterization (aquifer chemistry). Check out our technical bulletin “Best Practice Low Flow Methods for Highest Quality Samples” for more details.
How do Drawdown Measurements Help Determine Aquifer Hydraulic Properties?
Subsurface characteristics can be determined though various aquifer tests.
An aquifer test is a controlled field test performed on one or more monitoring wells. Each type of aquifer test puts a different stress on the aquifer system and the resulting effects are observed and used to estimate hydraulic properties. Different tests are more suited to certain aquifer types, i.e. confined, unconfined, leaky, artesian, etc.
In general, water levels, more importantly; drawdown levels are monitored during aquifer characterization tests, such as pumping, slug, and constant-head tests. These tests provide information to determine fundamental aquifer characteristics including hydraulic conductivity, transmissivity, and storativity.
Hydraulic conductivity: a measure of how easily water can move through an aquifer.
Transmissivity: the rate at which groundwater flows through an aquifer’s entire saturated thickness (or a given unit width).
Storativity (storage coefficient): the volume of water released from aquifer storage with a decline in hydraulic head (drawdown).
Pumping Tests
Pumping tests are most common. Typically, pumping tests are used to estimate hydraulic properties, determine the amount of water available, potential recharge rates, storage potential, maximum withdrawal acceptable, and any impacts on surrounding wells or neighbouring water bodies.
During a pumping test, water is pumped out of a well/bore over a period of time, at a controlled rate. As pumping occurs, groundwater levels decline (drawdown). When the pump is turned off, groundwater levels recover. Drawdown is measured in the pumping well, and also in surrounding monitoring wells, throughout the test period. Pumping tests can be constant rate, or step-drawdown where durations of increasing pumping rates create varying levels of drawdown over time. Time vs. drawdown and recovery data is then used to estimate hydraulic properties of the aquifer.

Groundwater Level Baseline, Pumping (Drawdown), and Recovery Data From a Pumping Test
Other tests include slug tests and constant-head tests.
Slug Tests
A slug test involves creating a sudden change in water level (water added or removed) and observing the recovery of the well to its original state. Typically, these tests are much smaller in scale, simpler and shorter than pumping tests, which can last 24 hours or even weeks. Slug tests can also be done prior to a pumping test to help with the design of the longer, more involved aquifer test.
Constant-head Tests
A constant-head (or constant-drawdown) test keeps the head (water level) in the control well at the same level throughout the test (maintains the drawdown level). The discharge rate from the well is monitored over time. Changes in water levels in surrounding wells are monitored.
Typical with all aquifer tests, the collected data is used to curve-match with existing mathematical models (type curves) to interpret aquifer hydraulic properties. A number of powerful software packages are available for quick and easy analysis of data from various types of aquifer tests.
How a Levelogger and 101D Water Level DrawDown Meter are Essential Tools
It is now common practice to use pressure transducers with built-in dataloggers to record water level data during aquifer tests, as it fully automates data collection – especially when more frequent readings are required. Using a Levelogger increases the accuracy and productivity of a pumping test, compared to only using manual water level measurements, as was done in the past.
Water level measurements should be made before, during and following stress being put on an aquifer. Using Levelogger Software, scheduled sampling sets the rates at which the water level data is collected for a number of separate intervals, allowing the typical aquifer test logarithmic-style sampling schedule to be set. You can customize a program to record water levels before, during, and after a pumping test (baseline, drawdown, and aquifer recovery).
Although not efficient for the bulk of the aquifer test readings, manual measurements are also a vital part of an aquifer test, for a number of reasons.
Prior to applying stress to the aquifer, a manual depth to water measurement (with date and time) should be recorded from each well using the 101D Water Level DrawDown Meter. This data can be used to ensure the Leveloggers are recording properly. Taking periodic water level measurements throughout, and at the end of the test period, is good quality control.
Manual water level readings can also be used to adjust all pressure readings in a logged file, to express the data as depth to water or elevation values. You can use the Manual Data Adjustment option in the Levelogger Software Data Wizard and input the manual readings.
The 101D Water Level DrawDown Meter in drawdown mode is excellent for tests that require a constant level of drawdown, such as during a constant-head or step-drawdown aquifer test. The 101D sounds when the probe is in air, allowing you to adjust pumping rates as required to maintain the level of drawdown.
Read more tips on how a Solinst Levelogger, LevelVent or AquaVent water level datalogger can be used in your next pumping test in our blog post “Simplify Your Pumping Test With A Water Level Datalogger“.
3 Reasons to Add a 101D Water Level DrawDown Meter to Your Groundwater Monitoring Program
- Low-Flow (Minimal Drawdown) Ground-Water Sampling Procedures. Robert Pulse and Michael Barcelona put it right in the title of their paper (EPA/540/S-95/504, Dec. 1995). Keep track of pumping levels during groundwater sampling to minimize stress (drawdown) on the formation.
- Ensure that the air/water interface remains above the pump intake, particularly when sampling groundwater for metals and VOCs.
- Setup a pumping well alarm. Position the 101D Water Level DrawDown probe at a predetermined level, where the buzzer and light will be activated if the pumping level reaches that depth.
Resources
British Columbia Ministry Environment, 2010. Guide to Conducting Well Pumping Tests. ISBN 978-0-7726-7033-5.
Ontario Ministry of the Environment, Conservation and Parks. Technical Guidance Document for Hydrogeological Studies in Support of Category 3 Applications(online)
Theis, C. V., 1935. The relation between the lowering of the piezometric surface and the rate and duration of discharge of a well using groundwater storage. American Geophysical Union Trans., vol. 16, pp. 519-524.
United States Environmental Protection Agency, 1993. Suggested Operating Procedures for Aquifer Pumping Tests. EPA/540/S-93/503.