According to the Canadian Disaster Database, “disaster floods” are occurring more often, and in general, the US National Climate Assessment reports that heavy rainfall events are on the rise worldwide.
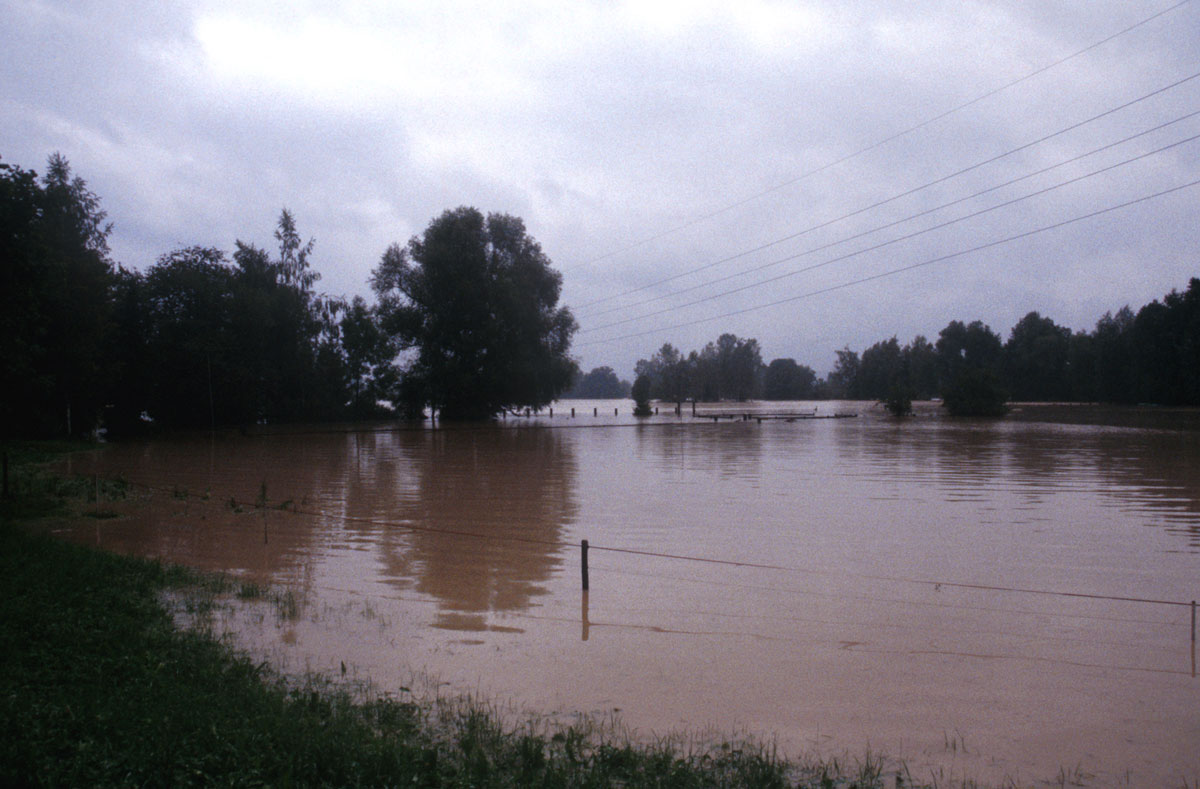
With an Increase in Flood Events, Comes an Increase in Need for Accurate Water Level Data.
With flood events and destructive downpours intensifying—much of which can be attributed to climate change—the need for more detailed flood data is growing.
More accurate flood data allows better decision-making by watershed and emergency managers, including emergency preparedness measures, evacuation orders, road closures, and the operation of reservoirs, dykes and dams.
The USGS Arizona Water Science Center is one agency working to establish new methods for recording accurate, long-term flood data to facilitate sounder decisions.
Stream Flow Monitoring
The USGS in Arizona has been monitoring stream flow since the 1890s. Currently, they have over 200 stream gauges throughout the state. They aim to increase understanding and predict the impacts of flood events by collecting long-term stream flow data.
Existing flood event measurements include surveying high water marks after a high stream flow, and direct (in-person) discharge measurements during an actual flood event.
However, the high water mark surveys provide information on the peak level and discharge but do not provide the full picture of water level rise and fall over the entire flood event.
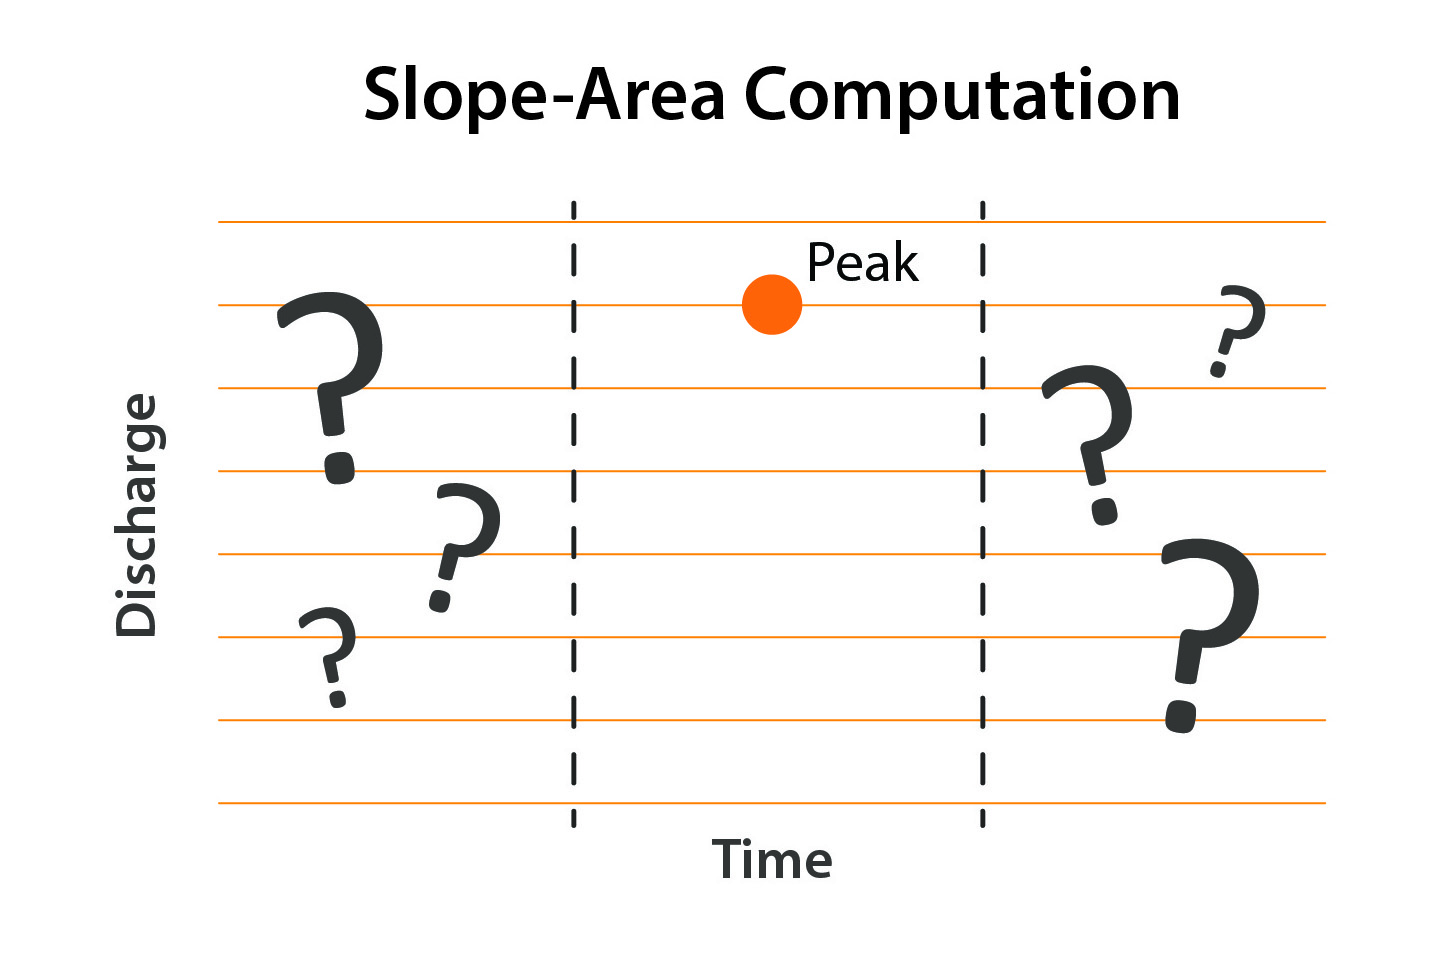
High Level Marks Don’t Provide Water Level Data Over the Entire Flood Event (Image Source: USGS)
Also, direct discharge measurements can be dangerous and cannot be performed in remote, hard-to-access locations during a flood event.
Continuous Slope-Area Method
To overcome some of the data deficiencies, the USGS in Arizona is developing the Continuous Slope-Area (CSA) method.
The CSA method involves setting up a stretch (or reach) where continuous water level data is collected in a stream. Three or more water level dataloggers are installed in the stretch; each datalogger is located in a cross-section of the stream with similar characteristics including shape, slope and flow.
A great deal of research and field measurements (including LiDAR) goes into selecting appropriate stream reaches. Ideal locations include a straight stretch that is stable and not frequently scoured or filled. The reaches selected are also in areas that are usually inaccessible during flooding.
Surveys and field data are also used to determine the geometry and slope of the channel, which is required to calculate stream discharge along with the water level measurements.
Solinst Levelogger water level dataloggers are being utilized in this project. The Leveloggers are installed in robust metal enclosures, located on very sturdy posts embedded in the stream banks. Many are installed at existing stream gauges.
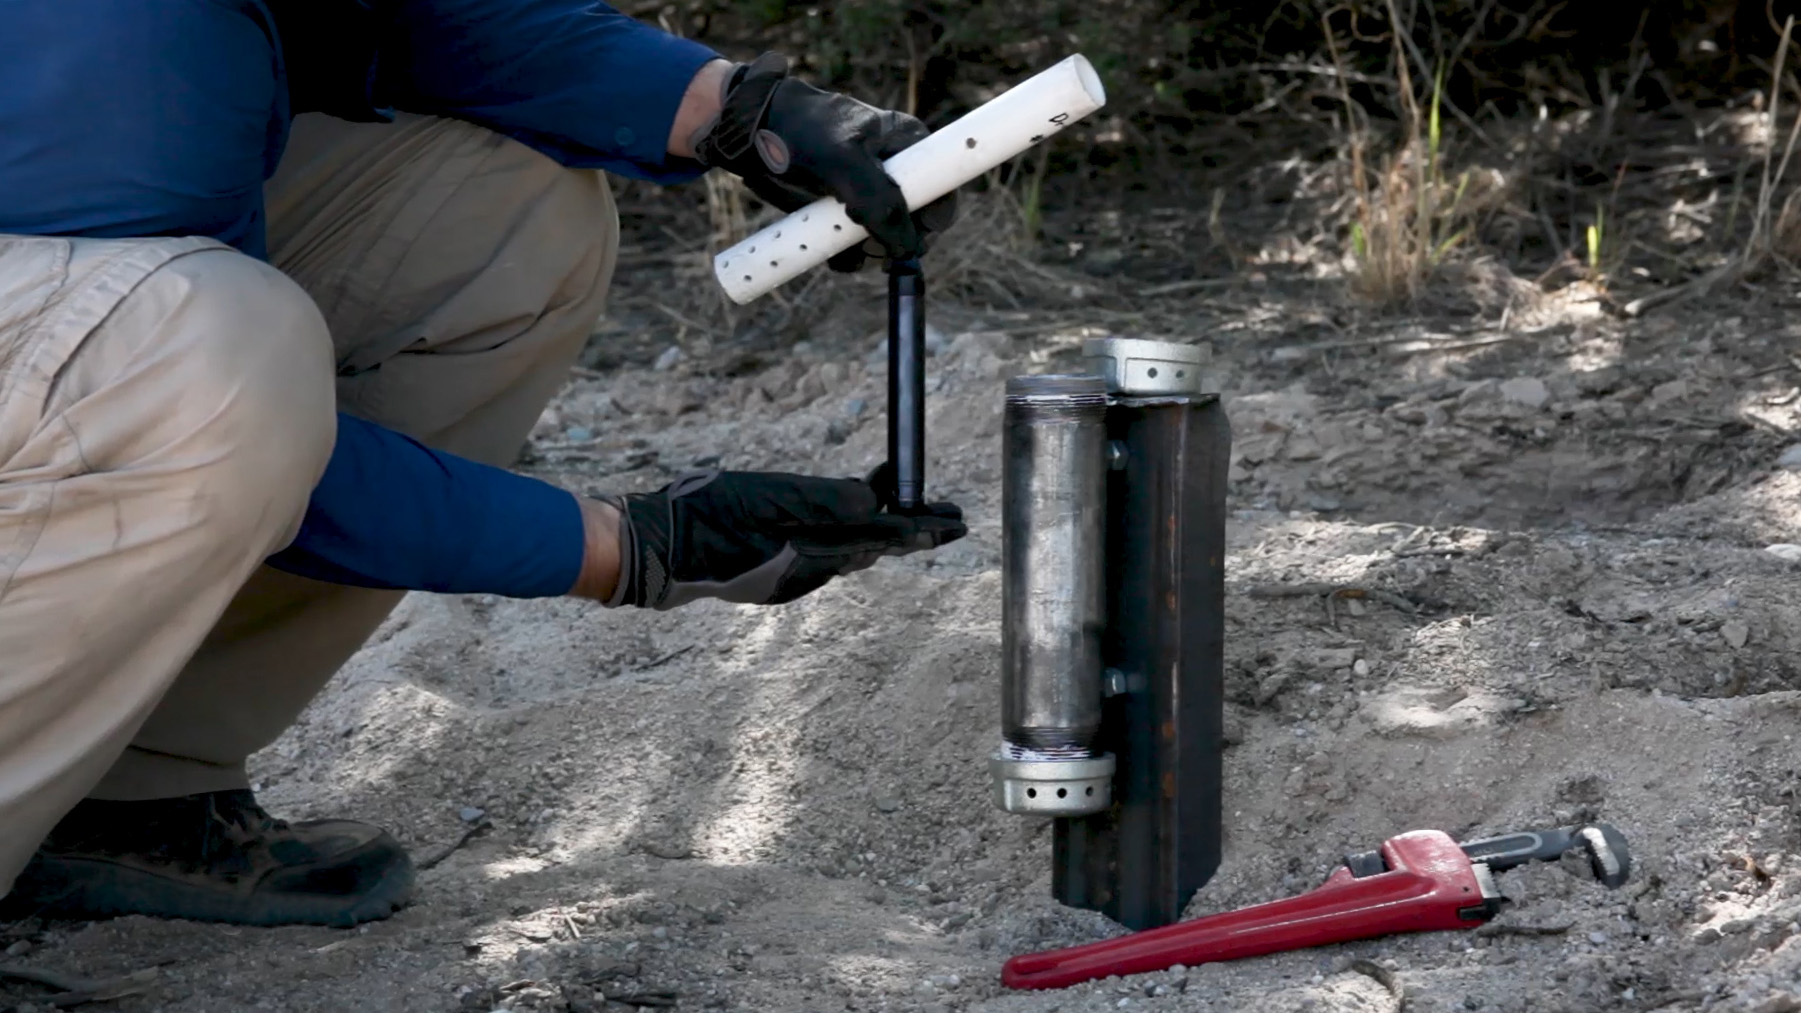
Solinst Levelogger Edge Installed in Metal Enclosure to Record Continuous Stream Level Measurements (Image Source: USGS)
For automated water level measurement, Solinst Leveloggers combine an absolute pressure sensor, temperature detector, and datalogger into a compact unit designed to be durable and virtually maintenance-free. Leveloggers feature a lithium battery, have robust memory and are programmed with user-friendly software. Leveloggers can be set to record continuous, high-frequency readings (as often as every 0.125 seconds), and can be left in the field unattended for extended periods.
One Barologger is installed at each site to provide barometric data, which is later used to compensate the Levelogger data.
The dataloggers have been deployed in various types of streams, including sand channels, bedrock, and cobble channels.

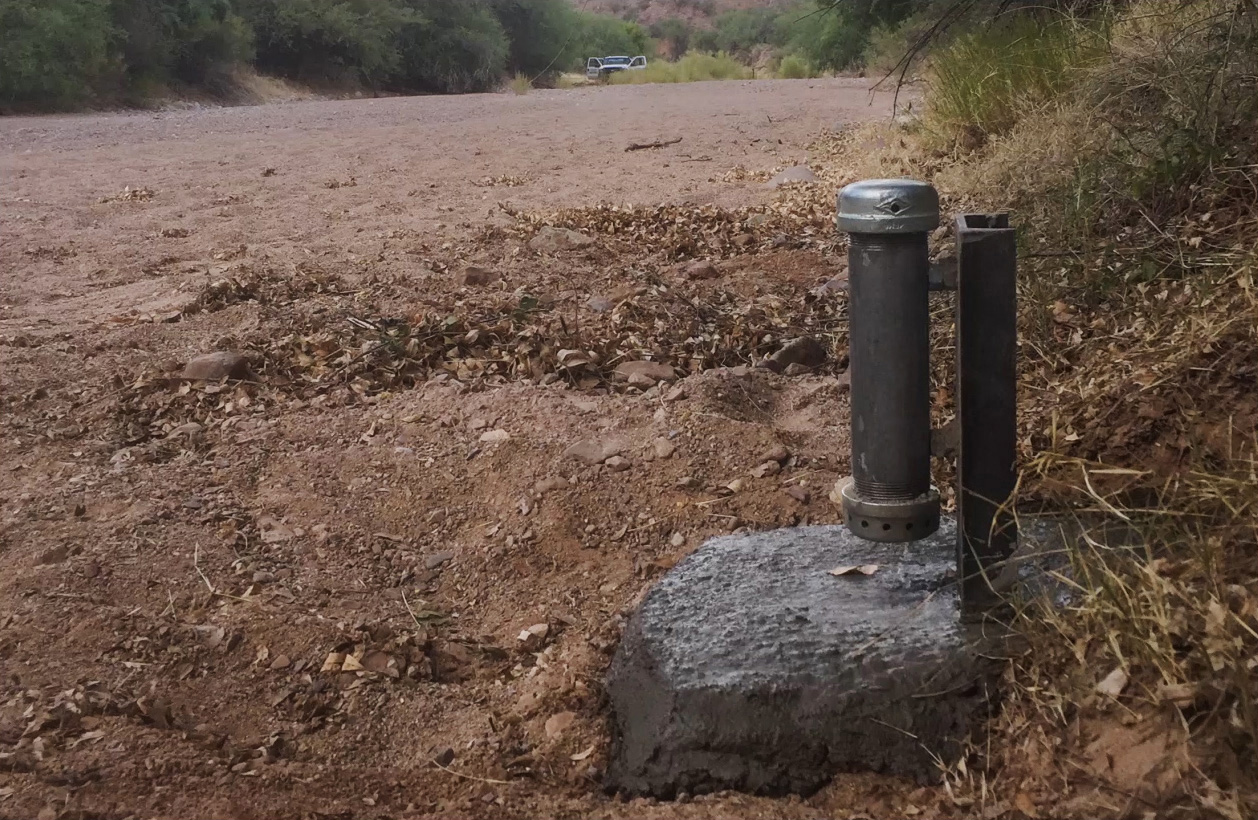
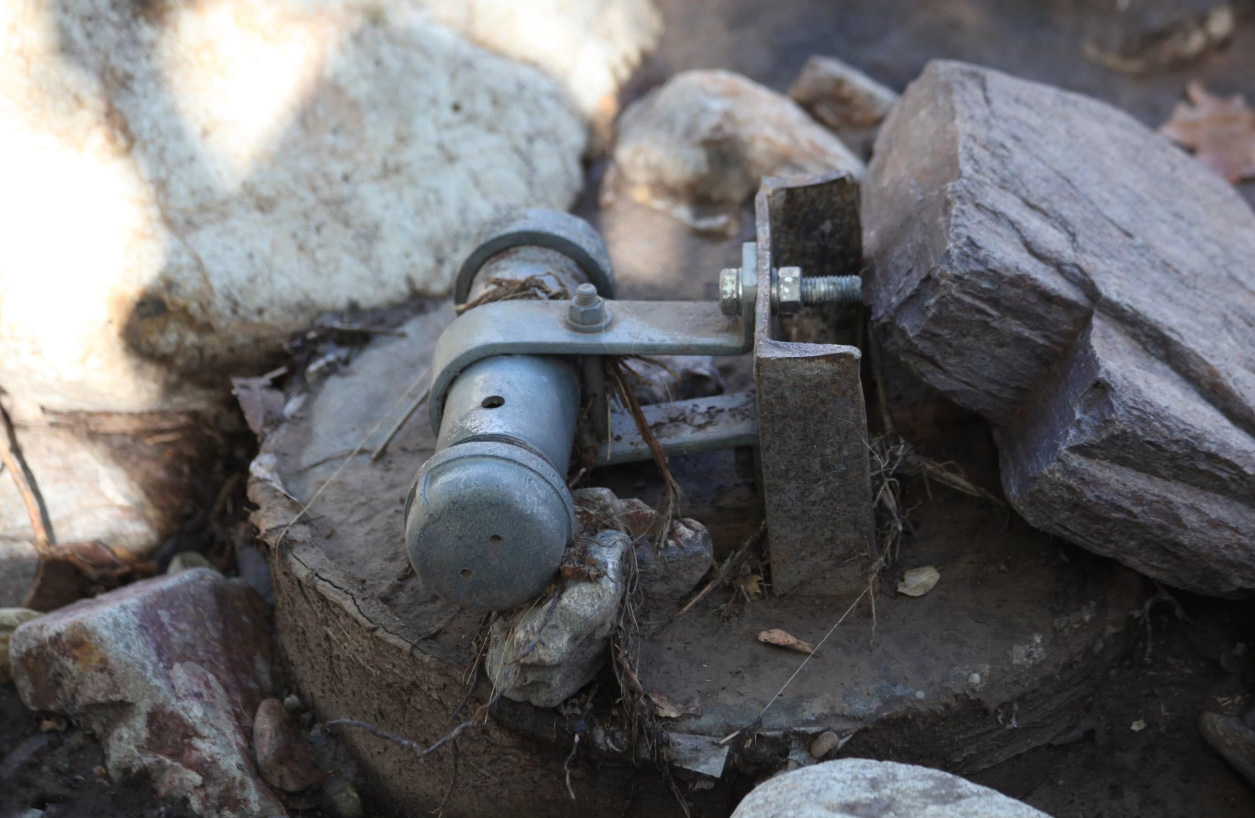
Solinst Levelogger Water Level Dataloggers Installed in Metal Enclosures in Various Types of Steam Channels (Image Source: USGS)
The dataloggers are set to record water level readings every five minutes, for up to one year. In addition to annually, the data is downloaded from the Leveloggers and Barologgers after each major flow event.
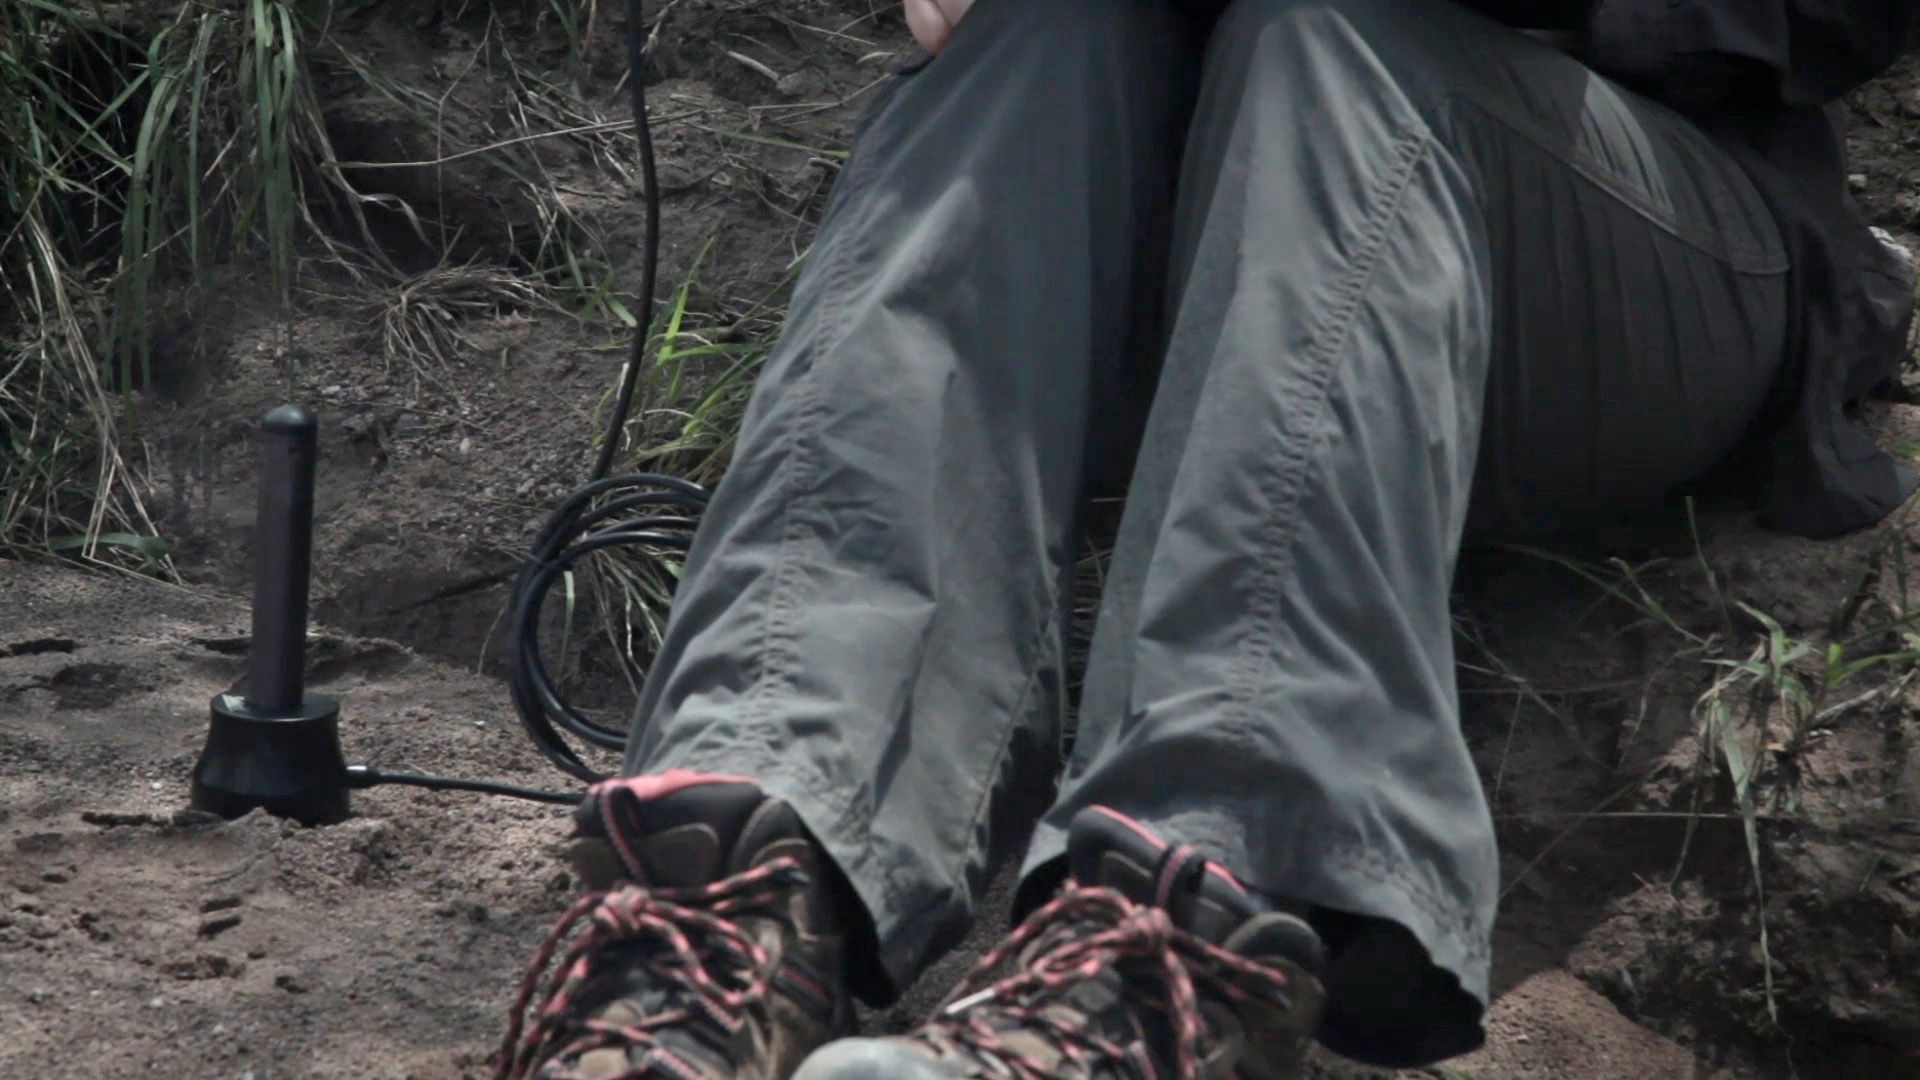
Levelogger Water Level Data is Downloaded Annually and After Each Flood Event (Image Source: USGS)
Improved Stream Flow Data
The continuous data recorded by the Levelogger water level dataloggers provide complete flood hydrographs. This allows the reconstruction of the entire flow event—not just the peak.
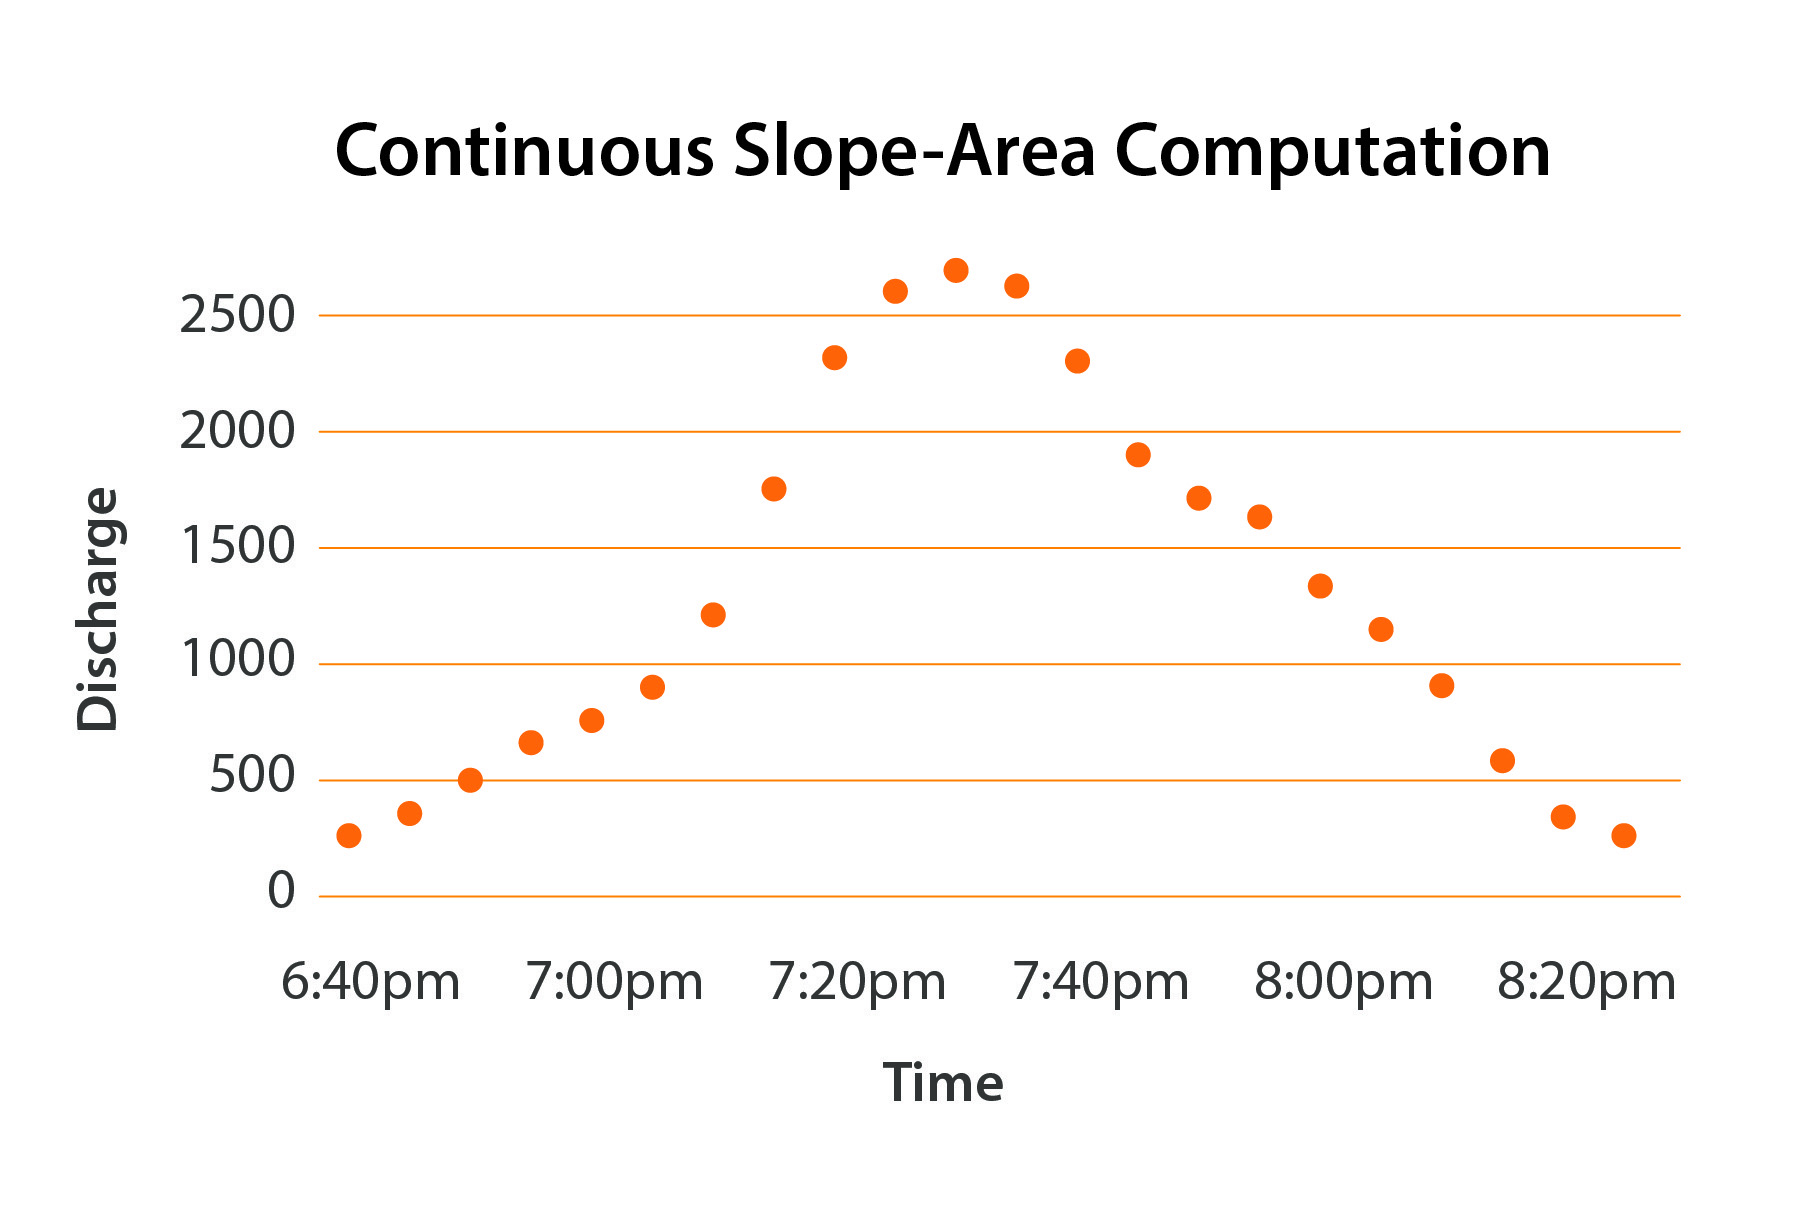
The Continuous-Slope Area Methods Provides Water Level Data Throughout the Entire Flood Event (Image Source: USGS)
With the known geometry of the stretch, the flow depths recorded by the Leveloggers can be used to calculate discharge during the rise and fall of the floodwaters. So far, field trials of this method have provided favourable results.
To further validate the CSA method, an experiment was conducted at the USDA Southwest Watershed Research Center. The Watershed Center has several flumes with fixed geometry used to perform controlled tests. The field trials have proved the accuracy of the method.
The new data provided by the CSA method is used to calibrate existing stage-discharge ratings and compare to past flows. The data is used to predict future flows and effects of flood events, as well as provide more accurate information to base immediate actions.
Overall, the CSA method provides more accurate measurements and reporting on stream flow events. With unstable weather inevitable into the future, the continuous long-term data will be a valuable resource moving forward.
To learn more about the CSA method, the USGS Arizona Water Science Center has produced a number of informative videos:
https://www.usgs.gov/media/videos/understanding-floods-long-term-streamflow-data-collection
https://www.usgs.gov/media/videos/reach-scale-monitoring-advances-stream-gaging
https://www.usgs.gov/media/videos/advances-streamgaging-reach-scale-monitoring-experiment-1-2
https://www.usgs.gov/media/videos/advances-streamgaging-reach-scale-monitoring-experiment-2-2
For more information on Solinst Levelogger water level dataloggers, contact one of our technical sales representatives, and they will be happy to discuss your monitoring applications.
