Building Community Resilience
Community resilience in the face of sea level rise and extreme events, such as atmospheric rivers and highest astronomical tides (HAT), is a pressing concern for coastal regions worldwide, including coastal California. James Jacobs, a PhD candidate researcher at the University of California Santa Cruz and experienced hydrogeologist, is investigating whether utility trenches carrying essential infrastructure contribute to increased vulnerability to coastal flooding in the San Francisco Bay Area.
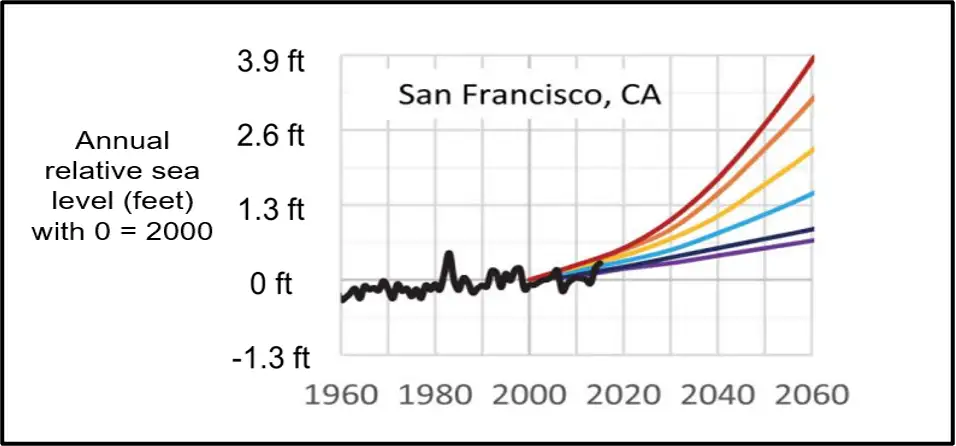
Currently, the sea level rise data available to these communities is vague and based on large-scale scenarios. Jacobs provides an example of a 2017 NOAA chart (see below) that depicts a variety of possible scenarios of sea level rise. It is hard for planning departments to use this type of data to make decisions and adapt to changes at a local scale. A conservative planner would accept the worst-case rise; however, this projection does not include the added effect of groundwater rise through preferential pathways. This projection uses NOAA’s modelling, which does not include the groundwater rise factor.
Jacobs’ investigation, based on data collected from wells and surface locations in the filled coastal fringe (both in and outside of preferential pathways), aims to establish baseline metrics for coastal flooding processes related to sea level rise and extreme events.
By analyzing groundwater in and outside of preferential flow pathways and surface water data, Jacobs seeks to understand the impact of preferential flow pathways, such as utility trenches, on exacerbating flooding from sea level rise and extreme events –currently experienced as highest tides and storms (atmospheric rivers). The utility trench hydrology will be collected, as well as baseline data, which can then be compared to future data when sea levels are higher.
Besides observing groundwater response to atmospheric rivers and HAT events, water level data will be used to confirm subsurface conditions contributing to suspected emerging groundwater in Manzanita, as documented in March and April 2024.
Surface and Groundwater Level Measurement Study Locations
To start the investigation, Jacobs identified representative vulnerable areas (to sea level rise, groundwater rise, HAT, and extreme rains). He identified sites with decades of historical flooding at different distances from coastal San Francisco Bay. For comparison, he selected well locations in known preferential pathways (utility trenches) and outside of utility trenches.
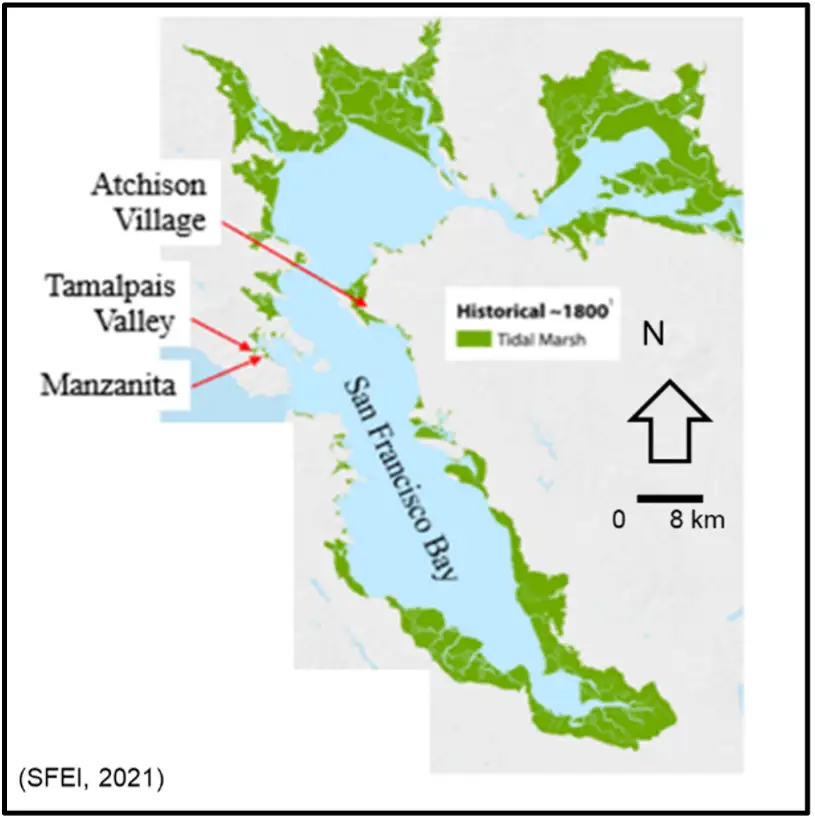
Currently, Jacobs’ investigation includes three study areas: Manzanita, southern Marin County, on Richardson Bay, an arm of the San Francisco Bay; Tamalpais Valley, southern Marin County, about 550 m southwest from the mouth of Coyote Creek, where it enters Richardson Bay; and Atchison Village in the City of Richmond, Contra Costa County, California, 833 m northeast of the Santa Fe Channel of the San Francisco Bay.
Subsurface soils and preferential flow pathways in the study areas were identified through historical maps and photographs and by installing groundwater monitoring wells inside and away from utility trenches. Manzanita and Tamalpais Valley wells are primarily installed within artificial fill over wetland deposits.
Surface and Groundwater Level Data Collection
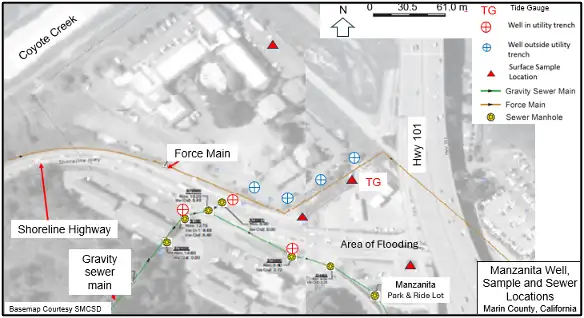
Jacobs installed groundwater monitoring wells in each study location to begin building baseline data. Installations included seven groundwater monitoring wells in Manzanita, four in Tamalpais Valley and two in Atchison Village; three existing irrigation wells in Atchison Village are also a part of the study. The investigation included a total of sixteen wells.
In addition to collecting groundwater well data, four surface water sampling/sensor locations were established in Manzanita (3) and Tamalpais Valley (1). Discrete surface water samples were obtained in Manzanita (5), Tamalpais Valley (1), and Atchison Village (3, plus multiple crawl space samples and a temporary post hole location).
Each well and the surface locations are equipped with a Solinst Levelogger, for a total of 20 permanent sensors, which have been collecting data at surveyed locations since 2022. The Leveloggers include LT (level and temperature) dataloggers and LTC (level, temperature, and conductivity) dataloggers. Many of the Leveloggers were donated by individuals or companies, including Solinst of Canada and Enviro-Tech (Solinst equipment distributor in California).
Jacobs said he chose Leveloggers because they “are rugged and consistent in their readings.” He further explained, “For research purposes, the user interface is relatively easy to work with, and Solinst technical support was helpful in getting me up to speed on the Leveloggers. It also helped that I received donations of older model Leveloggers that still worked just fine, and that allowed me to install units in more than a dozen wells and four surface water locations.”
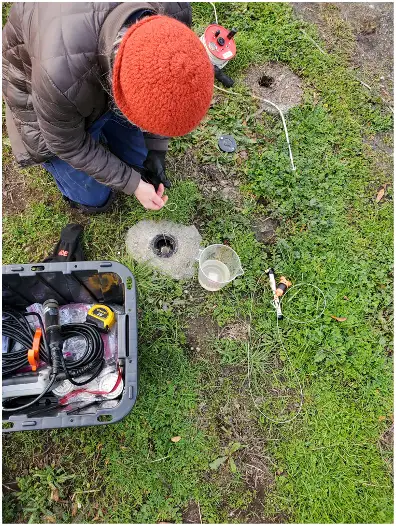
The Leveloggers are installed in the groundwater wells with a stainless steel cable. Stainless steel clips are used for the Leveloggers in the surface water sampling locations, and for one Levelogger used as a tide gauge in a tidally influenced drainage channel.
Jacobs also uses Solinst Water Level Meters, which work in the 1² (2.5 cm) diameter wells. He says, “These red water meters are easy to use in the field, are robust and work well.”
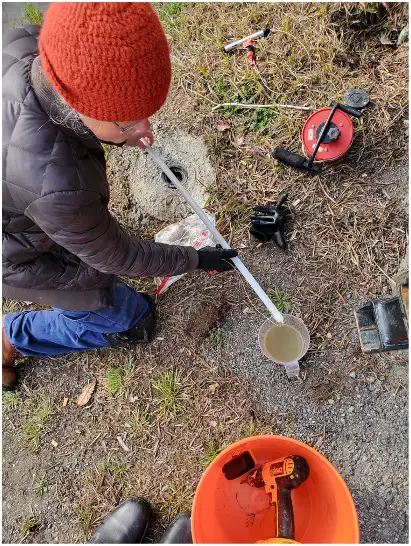
Jacobs also used a multiparameter water meter to measure dissolved oxygen (DO), oxidation-reduction potential (ORP), electrical conductivity, water temperature, and pH. Turbidity, field iron kits and a soil moisture meter were also used in the study.
Leveloggers are set to record every 15 minutes, with Barologgers (set close to the wells at each investigation study site) recording hourly to allow for later barometric compensation of the data. Weather station data from NOAA and Marin County (online) are used as a backup for barometric readings.
Discrete water sampling events were planned during six of the highest astronomical tide events and two low tide events. Most of the sampling events were conducted during the rainy season; however, one was completed during the dry season.
Data is downloaded every three months using Levelogger Software on a laptop. Jacobs noted, “I like that I can download a CSV file and convert it into Excel. It works well and is easy to use, and once I understood the software, it was efficient. I have it in the original Solinst (.xle) file format as well as CSV and Excel.” With respect to collaboration with interested parties, he adds, “If there are modellers out there who want to work with me, I am glad to share the data.”
Surface and Groundwater Level Monitoring Results and Ongoing Work
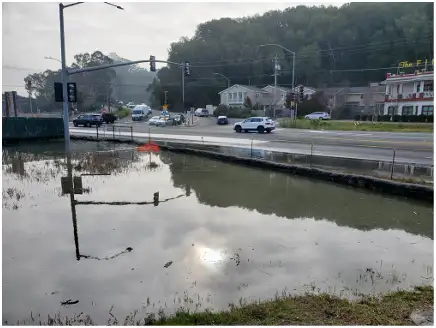
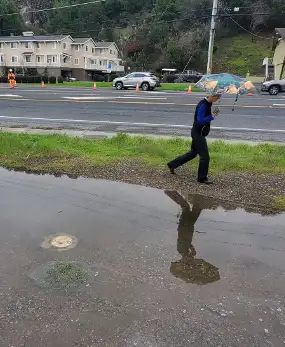
Jacobs’ investigation period (Water Year 2023), from October 1, 2022, to September 30, 2023, happened to occur during the most intense rains (atmospheric rivers) in 70 years of historical records! According to the NOAA data, there were 15 atmospheric rivers in northern California during this period, and 27 days had highest tides (defined as exceeding 6.2 feet amsl, the trigger height identified to close the local highway).
Because of this, Jacobs could see groundwater responses to extreme rains and the highest tides through the Levelogger data sets. He saw groundwater emergence in areas associated with the preferential pathways compared to the unaffected areas outside the utility trenches. This supports preferential pathways, exhibiting higher sensitivity to tidal action and/or surface flooding.
In the study areas, Jacobs already has evidence suggesting increased community vulnerability to sea level rise and extreme events, especially in locations with preferential pathways. As continued measurements are taken, this baseline data will show how flood vulnerability changes over time: data will validate the rate of sea level rise, document flooding of preferential pathway versus non-preferential pathways areas and document salinity variations in the coastal fringe.
Jacobs recommends that all coastal communities start compiling available data, including well bores, engineering studies, maps, and photographs, to help build a picture of preferential pathways in the area and install sensors like Leveloggers to identify current conditions and rates of change.
Jacobs also notes that simple, low-cost solutions exist for community flood prevention caused by higher tides and stormwater backup. For starters, regular maintenance of the storm drain pipes, cleanout of the storm drain grates and utility boxes, and placement of working flappers or duckbills on the outflow pipes, which empty into local surface drainage ditches or the San Francisco Bay, are needed.
Communities with a history of flooding should start collecting continuous water level data (with sensors) to document their baseline conditions. The data can be used to create a database for city and county planners and flood control districts. Jacobs says, “With adequate multi-year funding, a regional long-term data collection effort can be started and used to compile a searchable database of flood probabilities associated with specific hydrogeologic conditions.”
This ongoing research underscores the need for a comprehensive, long-term data collection effort to better predict and mitigate coastal flood risks. Jacobs’ work not only contributes to the scientific understanding of sea level rise and extreme event impacts, but it also informs crucial community-based strategies to enhance resilience in the face of environmental challenges.
Solinst thanks Jim Jacobs for providing the information about his work. You can read more about his studies at these links:
https://paytanlab.ucsc.edu/people/james-jim-jacobs/zoom-photo/
A NOAA California Sea Grant and a UCSC J. Casey Moore grant helped fund the field work, and other key equipment sponsors include Susan Loit of Solinst and Fred Ousey of Geo-Tech (Enviro-Tech). Jonnathan Le of Precision Enviro-Tech Laboratory provided laboratory analysis for the research.
If you would like to donate any old Leveloggers or other groundwater monitoring equipment to aid in his research, please get in touch!